Transducer Performance
The following performance curves summarize PMT-28 transducer behavior based on independent laboratory testing. They characterize the transducer's receive sensitivity, transmit efficiency, and directional response.
For questions about these measurements or to request the raw data used to generate the plots, contact Popoto Modem at info@popotomodem.com.
Performance Curves
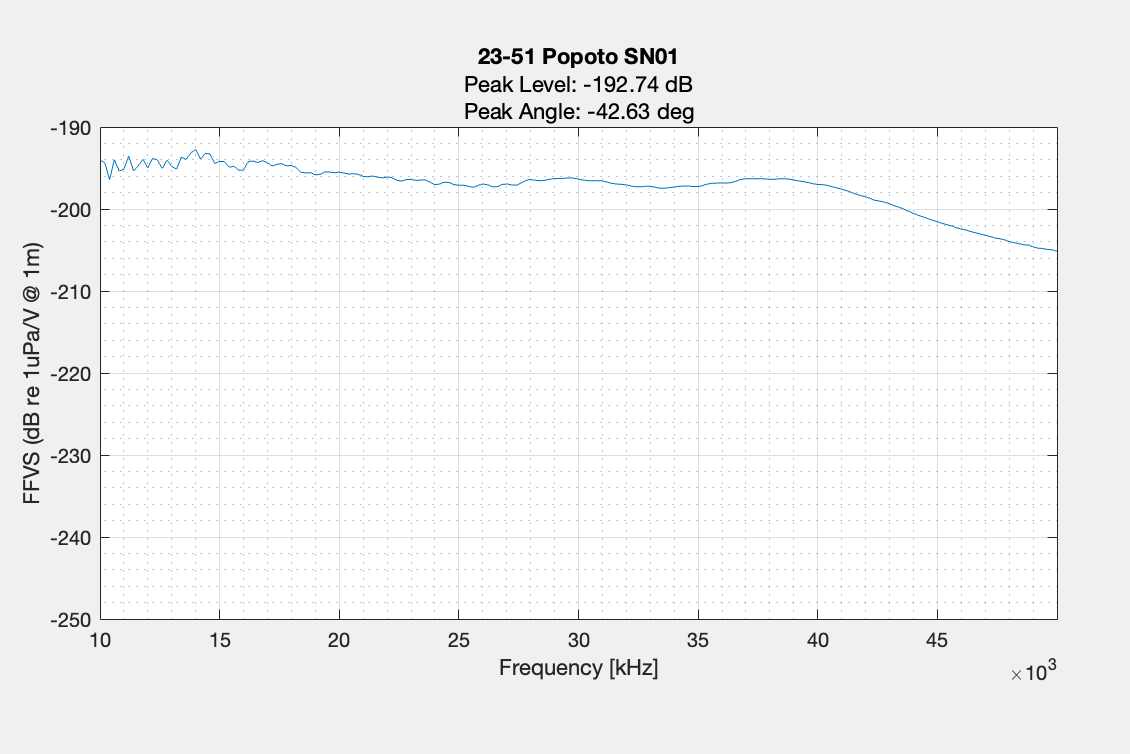
Free-Field Voltage Sensitivity
The free-field voltage sensitivity curve shows how effectively the transducer converts acoustic energy into electrical signals across the tested frequency range. This measurement characterizes the transducer's ability to detect and process incoming signals.
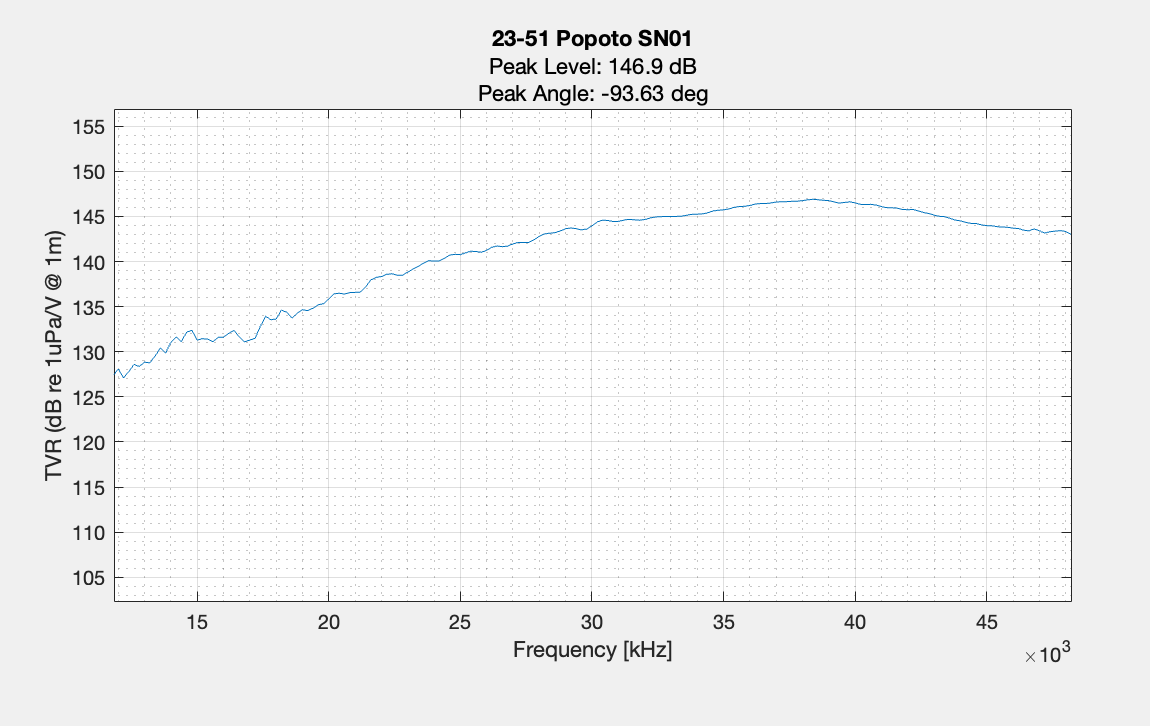
Transmit Voltage Response
The transmit voltage response curve shows how efficiently the transducer converts electrical signals into acoustic energy. This measurement helps characterize the transducer's acoustic output during transmission.
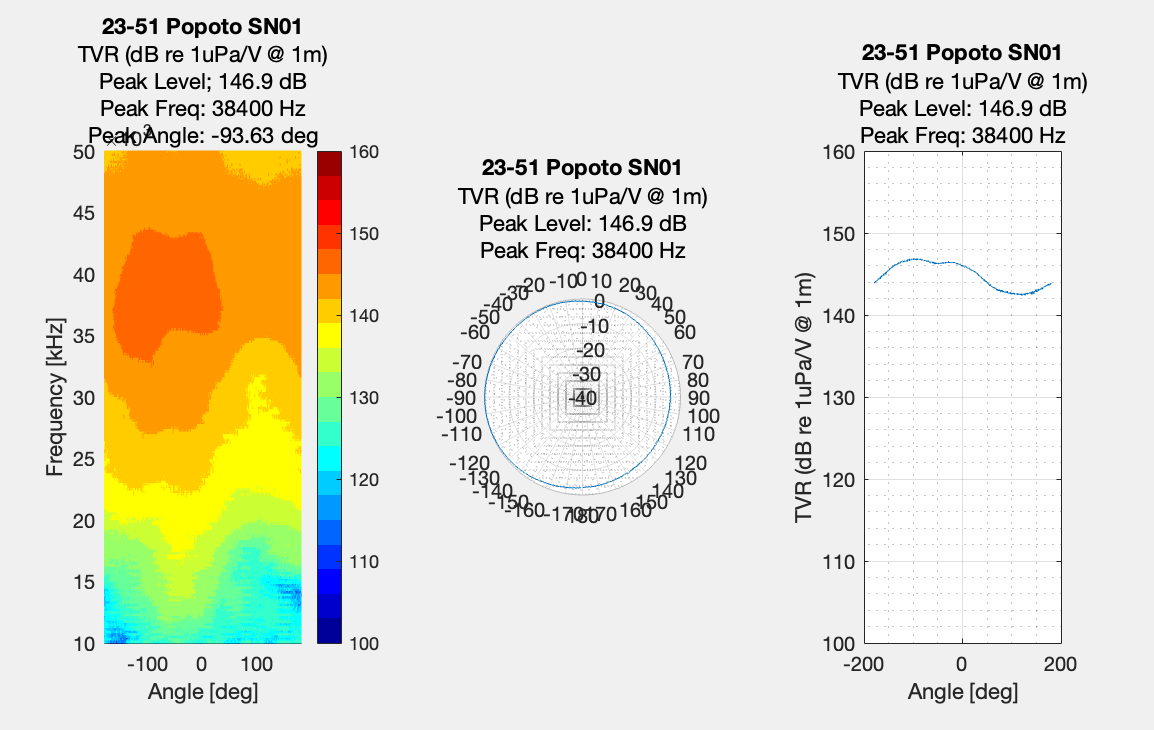
Transmit Beam Pattern
The transmit beam pattern shows the directional characteristics of the transducer's emitted signal. This information can be used to optimize system setup and coverage over the intended communication area.